
One Source of Truth for Your Company’s Data
THE RELIEF
THE DIFFERENCE
Stop Flying Blind—Get the Full Picture with Vision
Traditional reporting tools don’t show you what’s really happening in your network.
- Revenue lacks source clarity Revenue reports show total income, but not where it’s coming from.
- Complaints don’t map to regions Customer complaints are tracked, but not analyzed by region.
- Compliance takes reconciliation Regulatory work requires manual reconciliation.
- Limited financial visibility Hard to compare performance across areas and service zones.
- Growth planning is guesswork No way to see where network growth is needed.
- Compare performance by area Segment and compare grant-funded vs. private builds, zip codes, neighborhoods, and more.
- Monitoring maps reveal issues Spot network-wide service problems across the footprint.
- Regulatory reports with ease Generate required reporting without manual stitching.
- Automated financial tracking Revenue, tax, and invoice tracking across service areas.
- Expansion planning by reality Identify overbuilt vs. underserviced areas before you commit spend.
Location-Based Reporting: See Beyond Just Customers

Granular Revenue Mapping
Instantly break down revenue by zip code, neighborhood, or grant-funded area.

Growth & Underutilization Reports
Find overbuilt or underserved areas based on active vs. available service.

MDU & Business Complex Tracking
No more duplicate subscriber errors—Vision links multiple tenants to a single service address.

Connected Data Sources
Integrate GIS, network monitoring, and payment platforms for unified reporting.
Most telecom reporting tools track who’s paying you—but they don’t show where your network is succeeding or failing. Vision does.
Network-Wide Issue Tracking: Solve Problems Faster
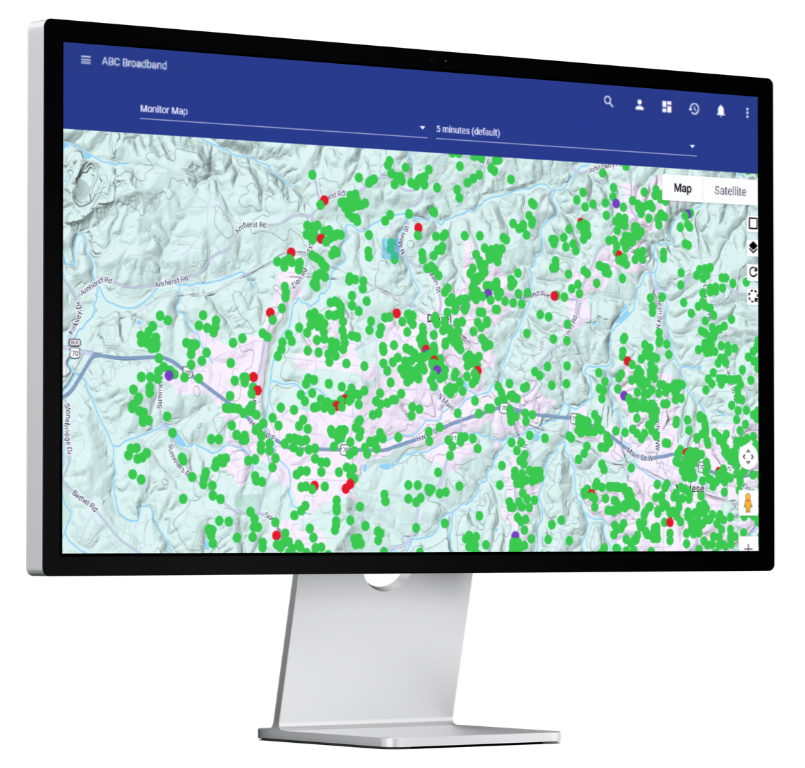
Trouble tickets aren’t just customer problems—they’re network problems. Vision logs issues by service location—not just by subscriber—helping you detect and fix network-wide failures before they escalate.
Service Issue Mapping – Identify repeat service failures by region before they impact retention.
Technician Response Time Reports – Track resolution times, missed SLAs, and problem areas by location.
Historical Service Issue Logs – Instantly pull all past trouble tickets for a service address—even across different subscribers.
Compliance Without the Chaos
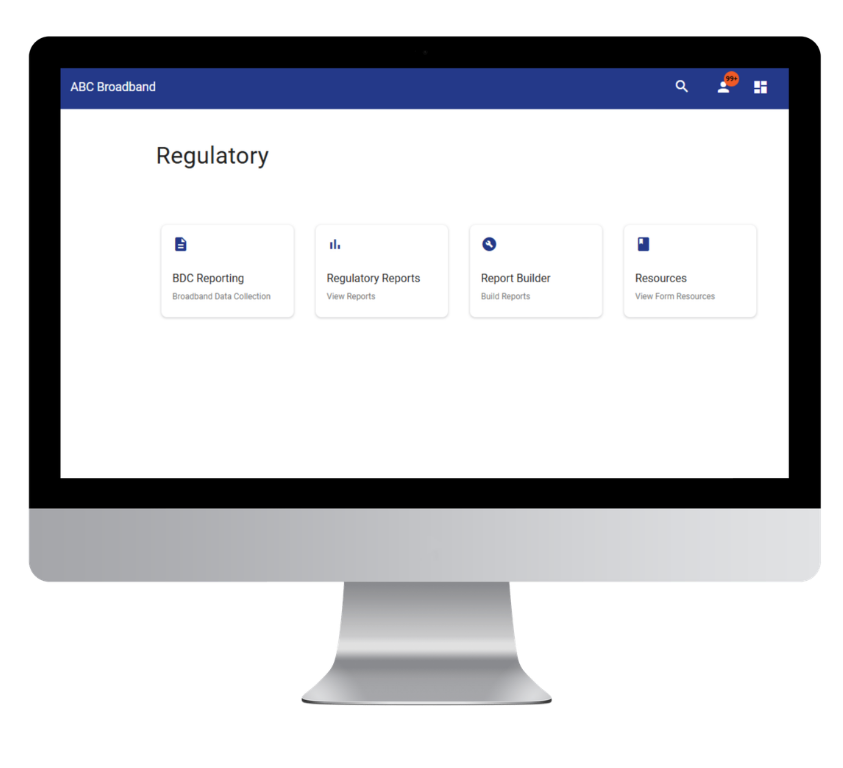
Regulatory filings require location-based data. Vision automates the process so you can file in minutes, not days.
Historical Compliance Data – Instantly recall past service speeds, coverage maps, and funding qualifications for audits.
Detailed Invoice & Payment Reports – Track revenue, overdue accounts, and payment trend
Grant Eligibility Tracking – Identify which service areas qualify for funding before you file.
Tax & Remittance Reporting – Automatically calculate state and federal tax obligations based on service location revenue.
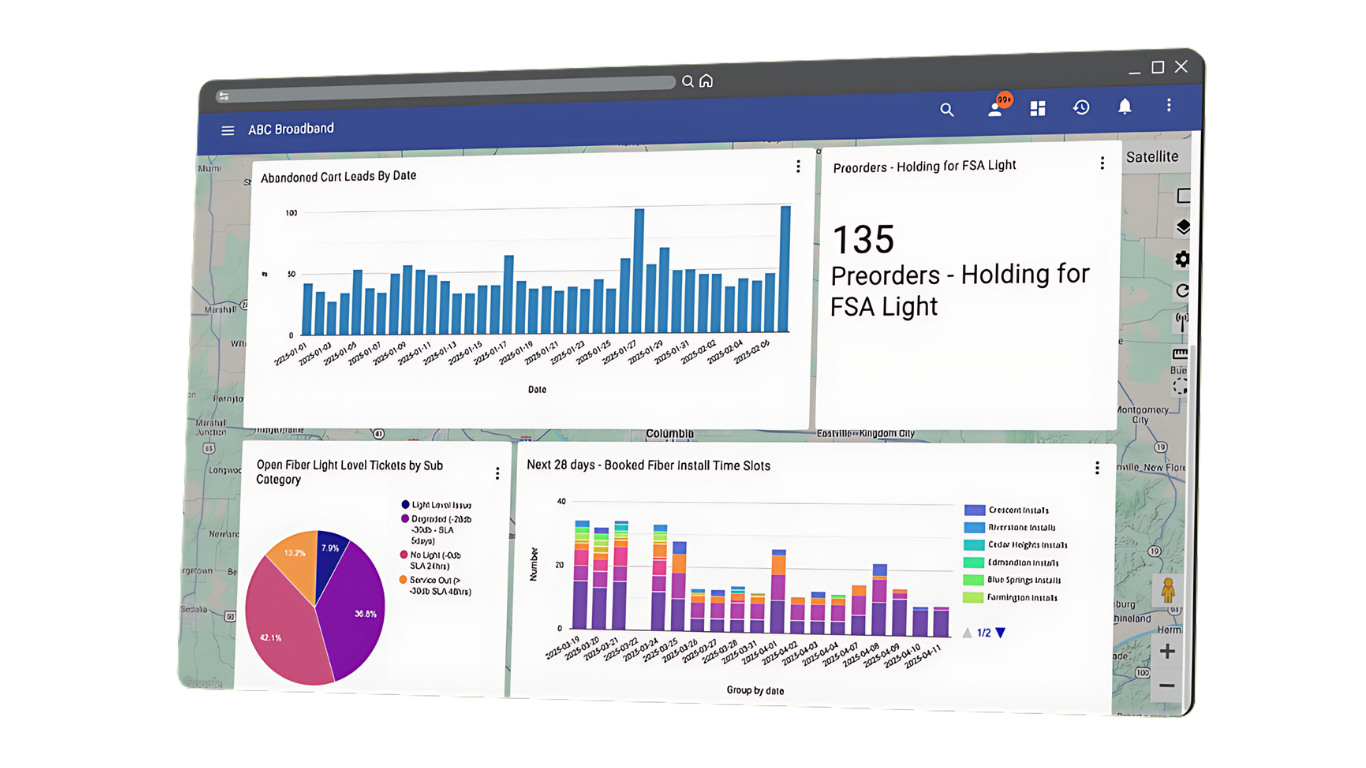
Live Dashboards: Real-Time Network Intelligence
Static reports leave you playing catch-up. Vision gives you live network insights so you can react instantly.

Live Network Performance Dashboard
Monitor uptime, subscriber trends, and overall network health in real time.

Custom Alerts & Metrics
Instant notifications for outages, overdue payments, or growth plateaus.

Dynamic Location-Based Filters
Drill down by neighborhood, grant area, or business district for precise insights.

Custom Report Builder
Generate on-demand reports tailored to your operations—no third-party analytics required.

Scheduled Reports & Data Exports
Automate financial, ticketing, or compliance reporting on your terms.
Stop Guessing. Get Real Answers Today.
Vision Reporting eliminates data silos and gives you location-first insights that subscriber-based tools can’t.